Bitcoin: Price Inches Closer to $30,000 – What to Expect?
Yesterday, gold saw a 2.1% increase in price, approaching an all-time high. On the other hand, Bitcoin is attempting to break through a resistance area of $28,800 to $29,000 that has been in place since mid-March.
Both assets have risen in recent weeks, with gold up 13% over the past month and Bitcoin up 27% over the past 30 days. The rally in gold prices is attributed to a weaker US dollar, lower expectations for key interest rates, and geopolitical tensions.
Investors are turning to safe-haven assets such as gold and Bitcoin due to weaknesses in the banking system and concerns about a potential recession in the US.
Recent macro data, including weaker-than-expected factory orders and a drop in job openings, has reinforced market expectations that the Federal Reserve will soon end rate hikes and start cutting rates later this year, contributing to the uptrend in Bitcoin and gold.
As of press time, Bitcoin is at $28,536 with a $15.2 billion 24-hour trading volume.
Bitcoin technical analysis
The Bitcoin price readings on the daily timeframe are sending mixed signals. There are some bullish indicators, such as the price breaking through the $24,800 resistance area and reaching a new yearly high of $29,380 on March 24. Additionally, the daily RSI broke out from its bearish divergence trendline and established it as support.
READ MORE: Government to Devalue Currency? – Expert Warns U.S. Dollar Could Lose Power
However, there are also some bearish indicators to consider. The price has formed a double-top pattern along with long upper wicks, and there is a new bearish divergence in the RSI.
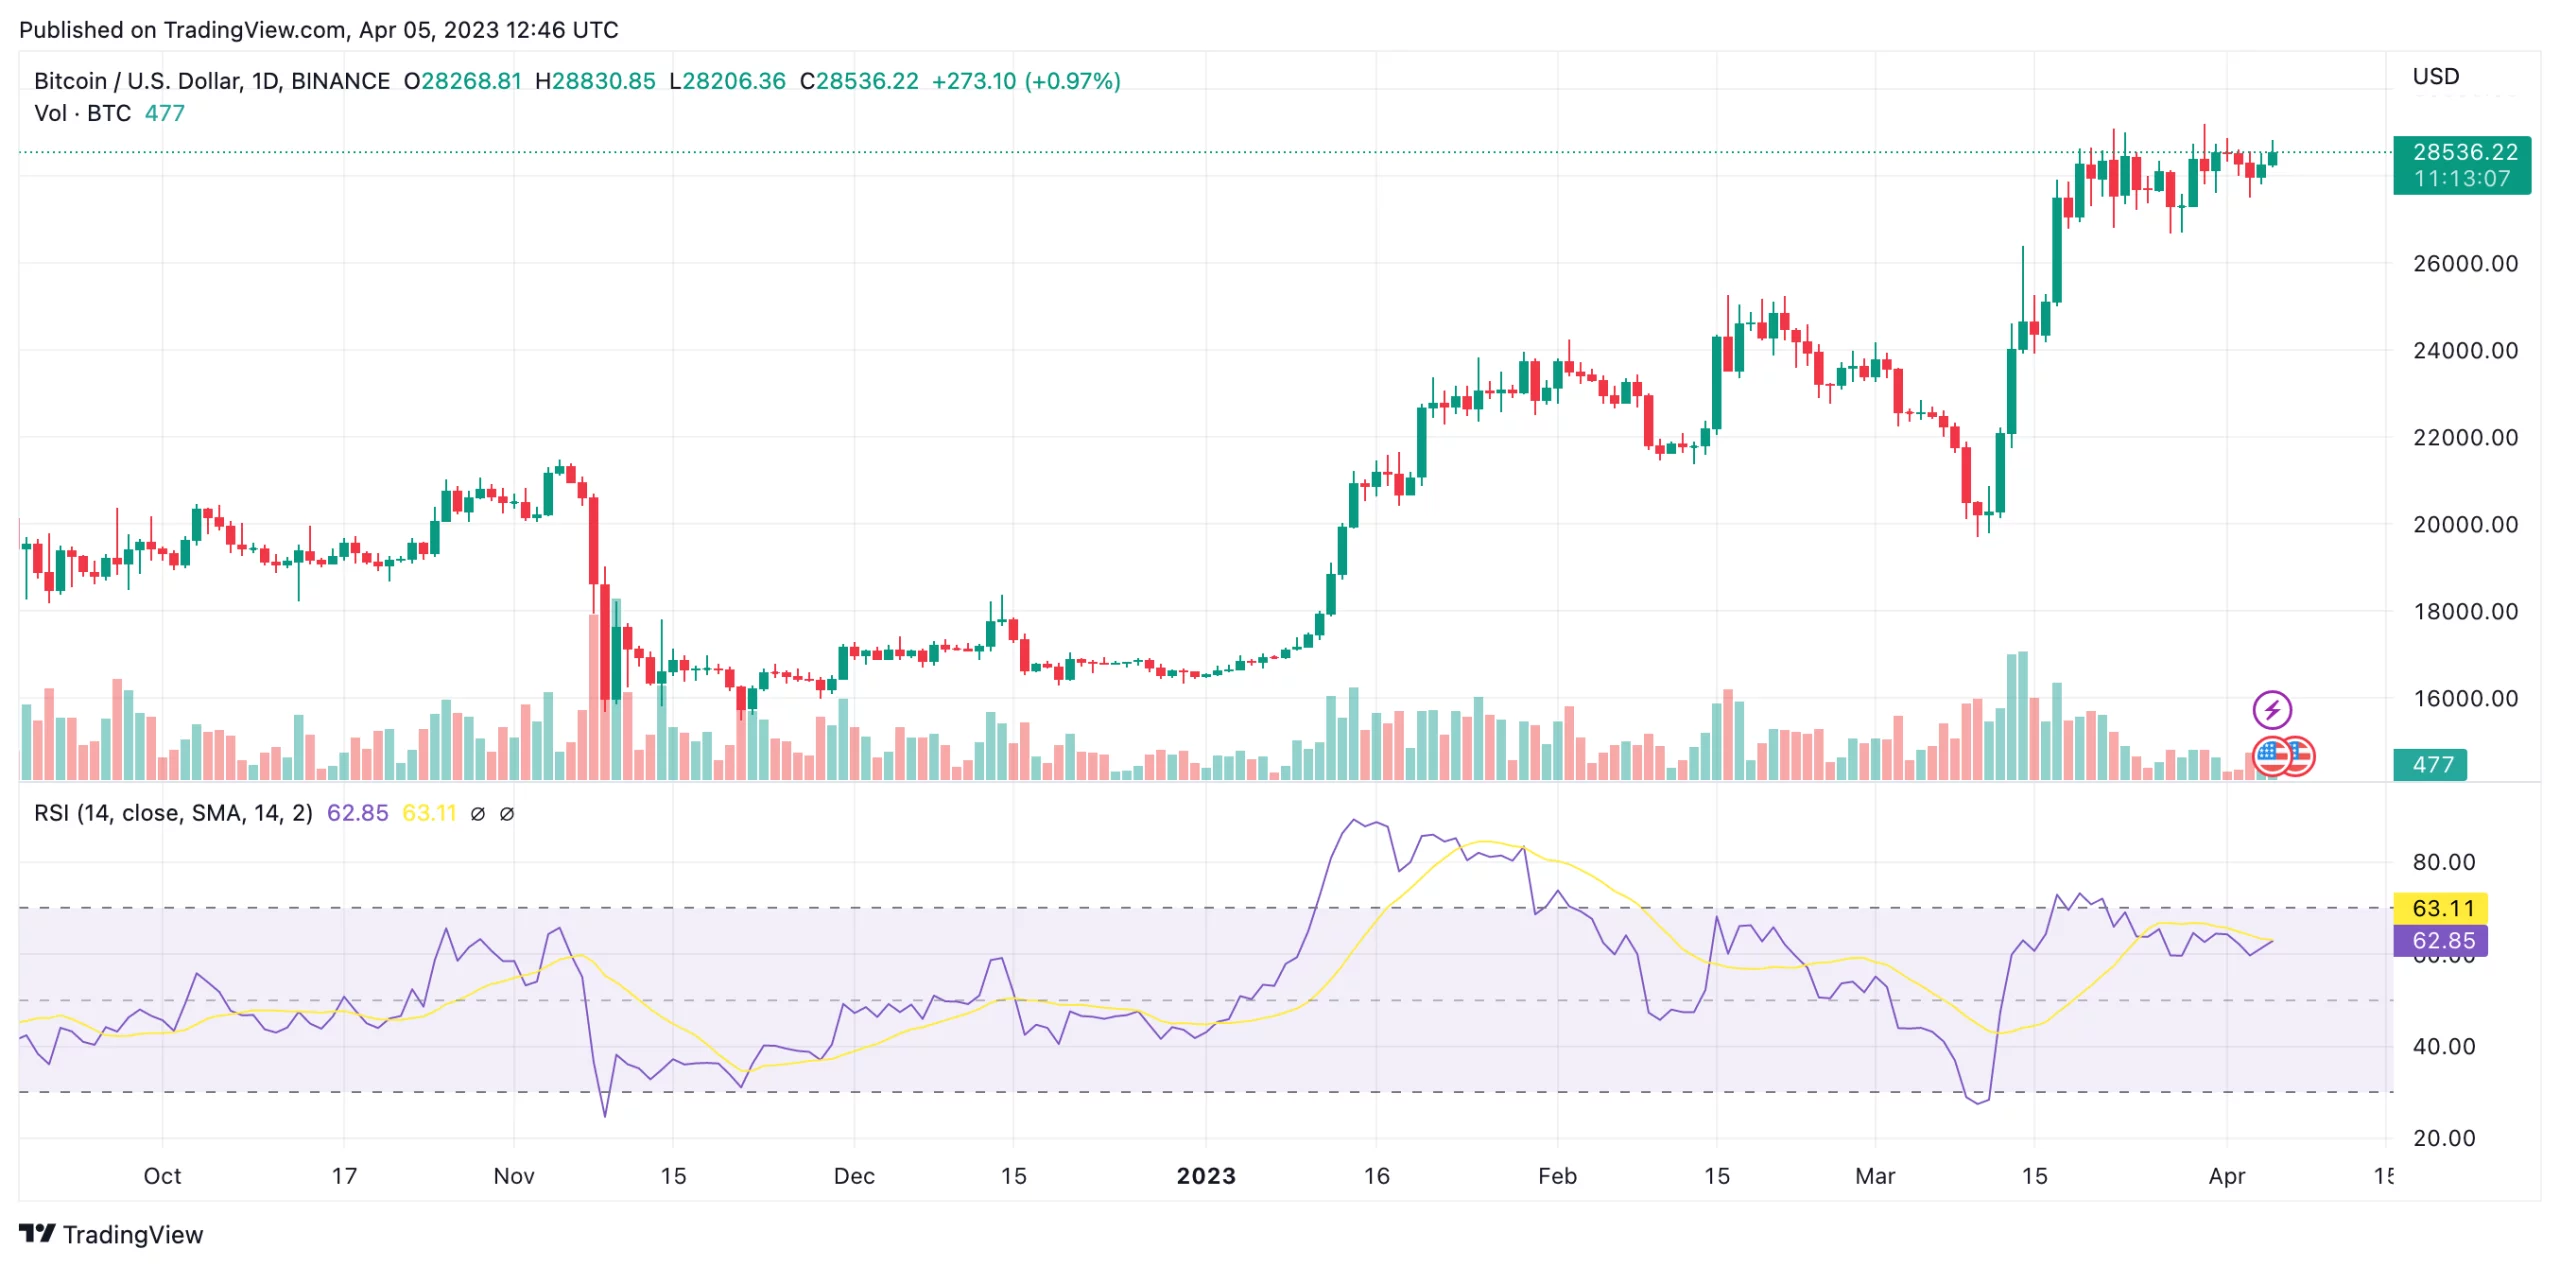
Given these conflicting signs, it is difficult to predict whether the BTC price will rise to the next resistance level of $31,800 or fall to the $24,800 support area.
Meanwhile, the BTC price broke through a descending resistance line that had been in place since its all-time high, and it was validated during the week of March 6-13, with a long lower wick and a bullish engulfing candlestick the following week. Furthermore, the weekly RSI moved above 50 for the first time since June 2021.
Thus, the weekly timeframe suggests that the BTC price will likely move towards its long-term resistance at $31,500, which aligns with the shorter-term resistance at $31,800. However, a weekly close below $24,600 would invalidate this bullish outlook, potentially leading to a drop towards $20,000.

Alexander Stefanov
Reporter at CoinsPress
Alex is an experienced finance journalist and a cryptocurrency and blockchain enthusiast. With over five years of experience covering the industry, he deeply understands the complex and constantly evolving world of digital assets. His insightful and thought-provoking articles provide readers with a clear picture of the latest developments and trends in the market. His passionate approach allows him to break down complex ideas into accessible and insightful content. Follow up on his content to be up to date with the most important trends and topics - stay ahead of the curve with CoinsPress.